If your computer seems to grind to a halt every once in a while, or your fans seem to be running often, and loudly, it’s a good idea to see if any particular program is causing the problem, or if your computer maybe just isn’t up to the tasks you’ve been giving it.
Maybe Firefox – with tons of tabs all running Flash games and YouTube videos – is the culprit, or maybe you have a “stuck” process from a program you thought you closed. The causes can be varied, but there’s one program in Linux that can at the very least give you a glimpse into what’s happening.
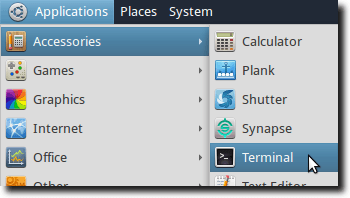
That is the top command. Using top is pretty simple. First, open a Terminal.

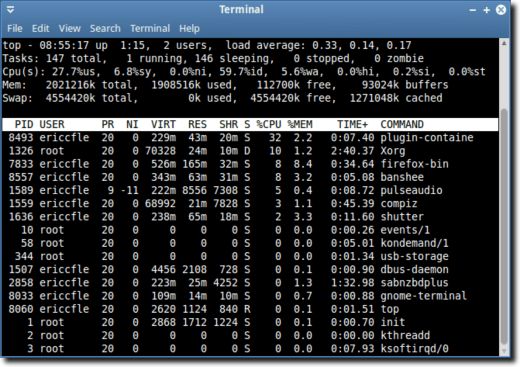
Now type “top” (without the quotes). That will give you a display like this:

Woah! What is all that? There is a ton of information that top provides, but what is it all, and how can it be useful to you? Here’s a line-by-line explanation, so you’ll know exactly what top is telling you.

This gives us the name of the program, the current time, how long the computer has been running, how many users are logged in, and the system load average for the last minute, five minutes and fifteen minutes.

This gives you information on how many processes are currently running. So in this example there are 147 processes that are currently “on” but only 1 of them was currently active, while the other 146 were sleeping. No processes were stopped, and none were in a zombie state.
A zombie process is simply a process that has completed its task, but is waiting for its parent (the program that asked for the task to be completed), to come back and see that the task was accomplished. Zombie processes aren’t a big deal, as they’ve finished their task, and don’t use any system memory or require any processing power.

Here we see how our processor is being used. This line, when all the percentages are figured in, will add up to 100 percent. From left to right, we see:
us = user processes
sy = system processes
ni = operations with priority upgrade using “nice” command
id = idle time
wa = waiting for I/O operations to complete
hi = time spent servicing hardware interrupts
si = time spent servicing software interrupts
st = time “stolen” (used by virtual machines)
Of all the above, the most common to look at would be user processes, system processes, and idle time. If the first two are low, it’s likely that idle time will be high, which means your computer – in general – is waiting for you, instead of you waiting for it to finish tasks.

These lines provide information on memory use. The first line is for your physical memory (RAM), while the second is for your swap memory. Ideally, you’ll see your RAM getting used, while your swap is only seldom used, although you may see a lot of swap memory being cached (programs “take” it in case they need it later).

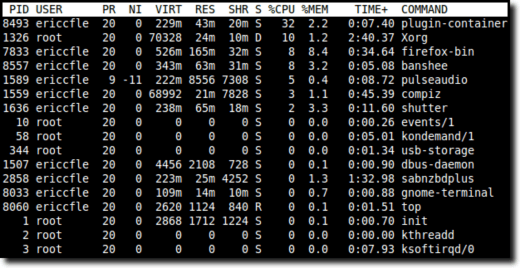
The final section shows you the processes on your computer (from highest load to lowest, top to bottom). From left to right, you’ll see the process ID, the user who initiated the process, and the process priority.
The “NI” again represents processes which have used the “nice” command for added priority. Then we have information on memory use. VIRT is for the amount of virtual memory being used by the program (swapping pages, storing code, etc.), RES shows us how much of our physical memory (RAM) is being used), while SHR is for the amount of shared memory.
The next column (S) is the current state of the program. A process with “S” in front of it is sleeping, while “R” means running. You may also find zombie processes (“Z”) in ths column as well. Finally, we see the percentage of your processor shares and physical RAM used by a particular process, plus the total time the process has been running. The COMMAND column shows us what command was used to start the process.
And there you have it. Looking at this admittedly complex report will show us if our computers are being overused, as well as which program/process might be the culprit. The top command can be a bit confusing, but the wealth of knowledge will really help tell us what we need to know about our suddenly sluggish computer.
Maybe Firefox – with tons of tabs all running Flash games and YouTube videos – is the culprit, or maybe you have a “stuck” process from a program you thought you closed. The causes can be varied, but there’s one program in Linux that can at the very least give you a glimpse into what’s happening.
That is the top command. Using top is pretty simple. First, open a Terminal.

Now type “top” (without the quotes). That will give you a display like this:

Woah! What is all that? There is a ton of information that top provides, but what is it all, and how can it be useful to you? Here’s a line-by-line explanation, so you’ll know exactly what top is telling you.
This gives us the name of the program, the current time, how long the computer has been running, how many users are logged in, and the system load average for the last minute, five minutes and fifteen minutes.
This gives you information on how many processes are currently running. So in this example there are 147 processes that are currently “on” but only 1 of them was currently active, while the other 146 were sleeping. No processes were stopped, and none were in a zombie state.
A zombie process is simply a process that has completed its task, but is waiting for its parent (the program that asked for the task to be completed), to come back and see that the task was accomplished. Zombie processes aren’t a big deal, as they’ve finished their task, and don’t use any system memory or require any processing power.
Here we see how our processor is being used. This line, when all the percentages are figured in, will add up to 100 percent. From left to right, we see:
us = user processes
sy = system processes
ni = operations with priority upgrade using “nice” command
id = idle time
wa = waiting for I/O operations to complete
hi = time spent servicing hardware interrupts
si = time spent servicing software interrupts
st = time “stolen” (used by virtual machines)
Of all the above, the most common to look at would be user processes, system processes, and idle time. If the first two are low, it’s likely that idle time will be high, which means your computer – in general – is waiting for you, instead of you waiting for it to finish tasks.
These lines provide information on memory use. The first line is for your physical memory (RAM), while the second is for your swap memory. Ideally, you’ll see your RAM getting used, while your swap is only seldom used, although you may see a lot of swap memory being cached (programs “take” it in case they need it later).

The final section shows you the processes on your computer (from highest load to lowest, top to bottom). From left to right, you’ll see the process ID, the user who initiated the process, and the process priority.
The “NI” again represents processes which have used the “nice” command for added priority. Then we have information on memory use. VIRT is for the amount of virtual memory being used by the program (swapping pages, storing code, etc.), RES shows us how much of our physical memory (RAM) is being used), while SHR is for the amount of shared memory.
The next column (S) is the current state of the program. A process with “S” in front of it is sleeping, while “R” means running. You may also find zombie processes (“Z”) in ths column as well. Finally, we see the percentage of your processor shares and physical RAM used by a particular process, plus the total time the process has been running. The COMMAND column shows us what command was used to start the process.
And there you have it. Looking at this admittedly complex report will show us if our computers are being overused, as well as which program/process might be the culprit. The top command can be a bit confusing, but the wealth of knowledge will really help tell us what we need to know about our suddenly sluggish computer.


No comments:
Post a Comment