Have you ever wondered which of your Facebook friends posts the most photos or the most status updates? Do you know how many of your Facebook friends went to college?
Most of what we see about our Facebook friends comes from our news feeds and the occasional glance at their profiles—which reveals very little other than their relationship statuses and what they had for dinner on any given day.
Facebook Spectrum generates statistical data that helps us visualize information about the people in our friends list.

Click the blue Login button on the top right corner of the Facebook Spectrum home page.

Click Allow when prompted to allow the service access to your Facebook account.
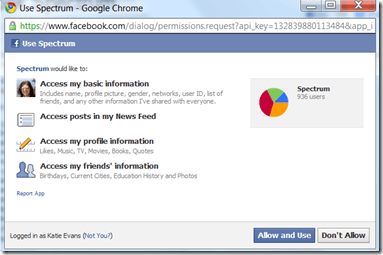
The service will then start aggregating data about your friends. This process may take a long time, depending on the number of Facebook friends you have. You can close this window and come back later.

Once loaded, the data Facebook Spectrum shows is very interesting. You can view a timeline of status updates for yourself, and any one of your friends. The little blue marks represent status update posts by month, day and year.

You can also view all of your friends’ birthdays on a single calendar.

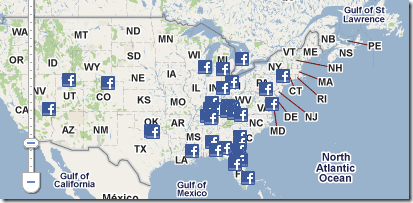
A map of the world reveals where all of your Facebook friends live.
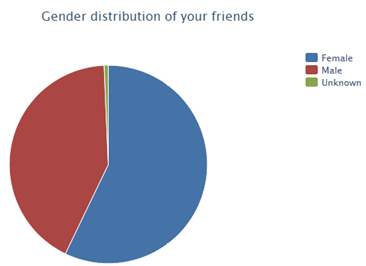
You can also see how many of your friends are male versus female.
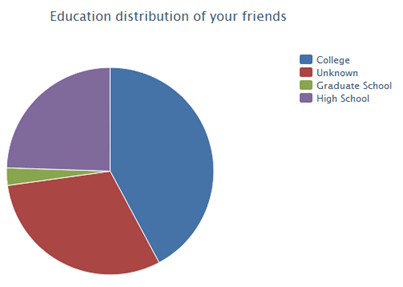
If you are interested in determining what percentage of your friends have a college or graduate school education, you can see this information on a pie graph. We were amazed by how many of our friends did not go to college.
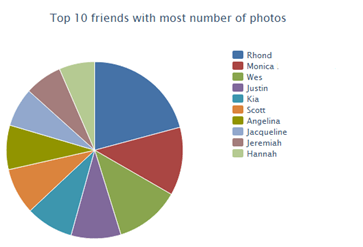
Or, view a pie chart showing which of your friends post the most pictures.
Facebook Spectrum offers a unique way to think about our Facebook friends. We found the map of where our friends live in relation to each other the most interesting—it is amazing to see how far apart our friends live!
The only complaint we have with the service is the amount of time it takes to aggregate the data for the first time. We waited more than an hour, and when no results displayed, we thought the service did not work—only to retry it the next day and see the data appear instantly.
Most of what we see about our Facebook friends comes from our news feeds and the occasional glance at their profiles—which reveals very little other than their relationship statuses and what they had for dinner on any given day.
Facebook Spectrum generates statistical data that helps us visualize information about the people in our friends list.

Click the blue Login button on the top right corner of the Facebook Spectrum home page.
Click Allow when prompted to allow the service access to your Facebook account.

The service will then start aggregating data about your friends. This process may take a long time, depending on the number of Facebook friends you have. You can close this window and come back later.
Once loaded, the data Facebook Spectrum shows is very interesting. You can view a timeline of status updates for yourself, and any one of your friends. The little blue marks represent status update posts by month, day and year.

You can also view all of your friends’ birthdays on a single calendar.

A map of the world reveals where all of your Facebook friends live.

You can also see how many of your friends are male versus female.

If you are interested in determining what percentage of your friends have a college or graduate school education, you can see this information on a pie graph. We were amazed by how many of our friends did not go to college.

Or, view a pie chart showing which of your friends post the most pictures.

Facebook Spectrum offers a unique way to think about our Facebook friends. We found the map of where our friends live in relation to each other the most interesting—it is amazing to see how far apart our friends live!
The only complaint we have with the service is the amount of time it takes to aggregate the data for the first time. We waited more than an hour, and when no results displayed, we thought the service did not work—only to retry it the next day and see the data appear instantly.


No comments:
Post a Comment